How to visualise capsule sessions with mur topology
Beta feature
mur topology is a beta feature and is hidden by default. Enable it first with
mur beta enable topology. It also requires a running OpenTelemetry trace
backend (e.g. Grafana Tempo) to query for spans — see Step 1 below. Behavior
and flags may change in future releases.
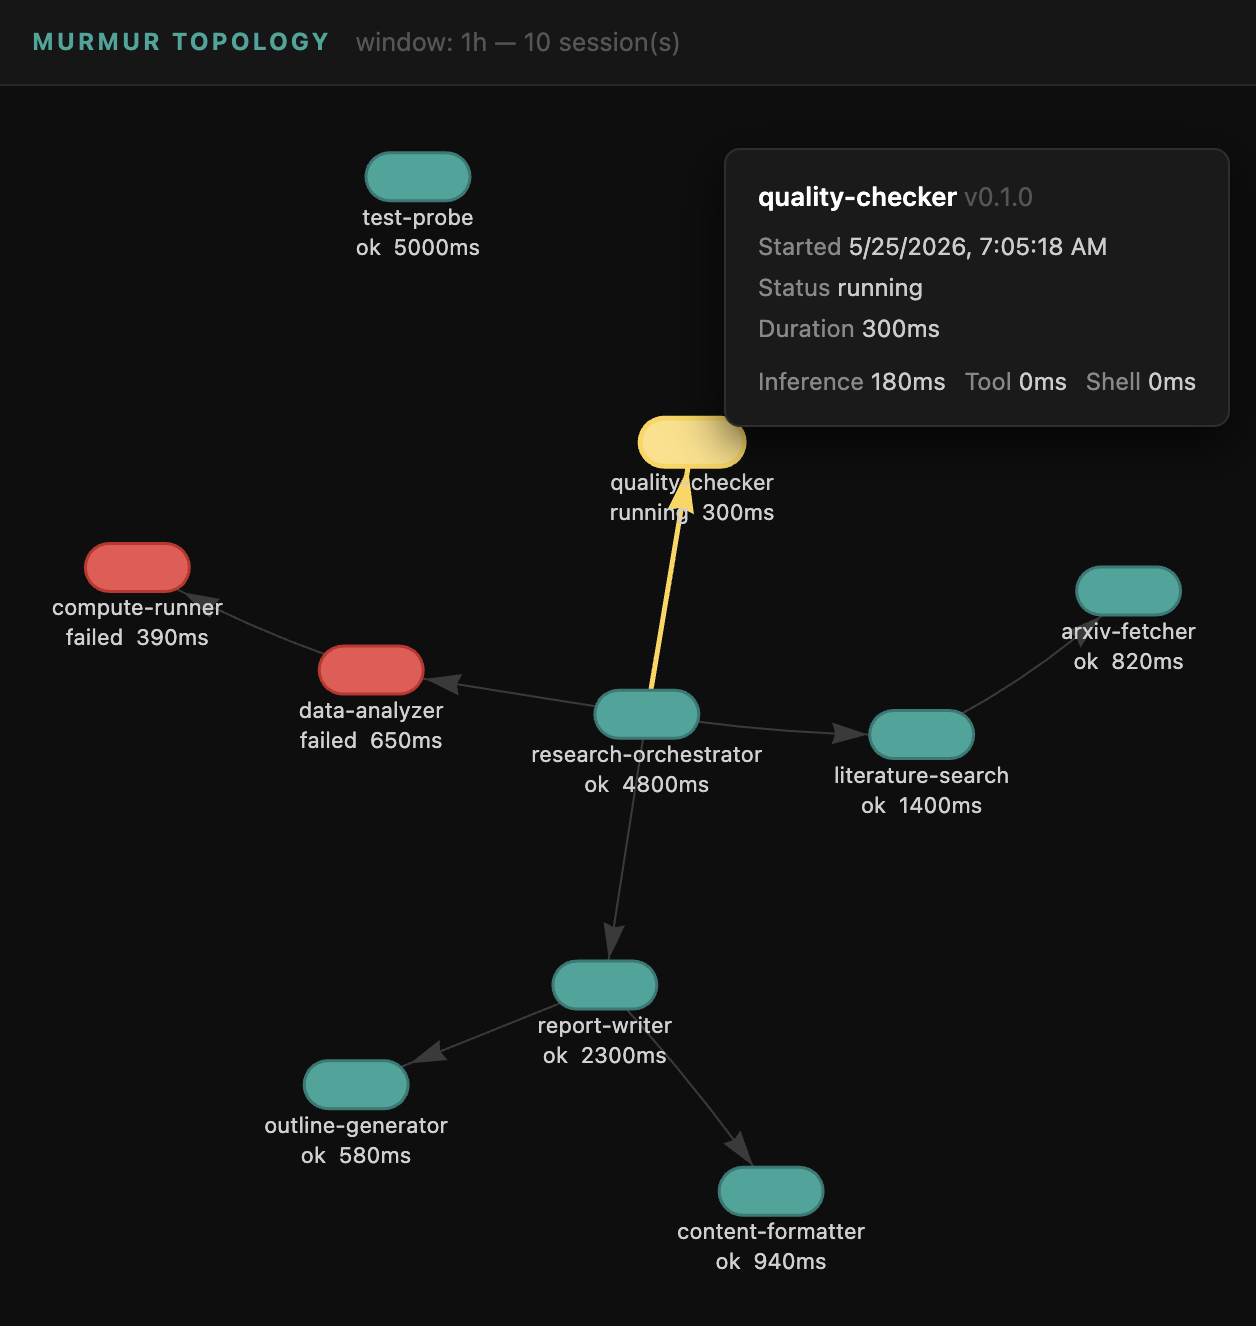
mur topology queries a Grafana Tempo backend for capsule.session spans, reconstructs which capsule called which, and renders an interactive graph in the browser. Each node represents one session — colour-coded by exit status — and directed edges follow A2A delegation paths. This guide walks through starting Tempo, generating real span data from capsule runs, and confirming the graph renders correctly for both single-capsule and multi-capsule scenarios.
Reach for this when you need to answer questions like:
- Did my A2A call actually fire? If you expected capsule A → B but only one node appears, the delegation never happened.
- Which session failed? Red nodes stand out immediately — hover for the exit status and per-span timing without digging through logs.
- Where did time go? The tooltip breaks down inference, tool, and shell milliseconds per session so you can see which capsule in a chain is the bottleneck.
The relevant manifest options are:
| Option | Controls |
|---|---|
| observability.otel_endpoint | OTLP/HTTP endpoint where the runtime posts spans at session end |
Step 1 — start Grafana Tempo
mur topology reads from the Tempo HTTP query API on port 3200. The capsule runtime writes spans to the OTLP ingest port on 4318. Both ports must be reachable.
Create a tempo.yaml configuration file in the directory you will run Tempo from:
server:
  http_listen_port: 3200

ingester:
  max_block_duration: 1m

distributor:
  receivers:
    otlp:
      protocols:
        http:
          endpoint: 0.0.0.0:4318

storage:
  trace:
    backend: local
    local:
      path: /tmp/tempo/traces
    wal:
      path: /tmp/tempo/wal
One setting matters for this guide:
ingester.max_block_duration: 1m— Tempo's default is 30 minutes. This cuts WAL blocks every minute so spans are flushed to searchable backend blocks quickly. Without it you wait up to 30 minutes beforemur topologyfinds any sessions.
Start Tempo on your machine with Docker, from the same directory as tempo.yaml:
docker run -d --name tempo \
  -p 4318:4318 -p 3200:3200 \
  -v $(pwd)/tempo.yaml:/etc/tempo.yaml \
  grafana/tempo:2.6.1 \
  -config.file=/etc/tempo.yaml
Confirm it is ready:
curl -s http://localhost:3200/ready
The response is the string ready.
Tempo version
Pin to a specific tag such as 2.6.1 rather than latest, which can resolve to a release candidate.
Step 2 — configure a capsule to emit spans
Create a murmur.yaml with observability.otel_endpoint pointing to the OTLP ingest port:
name: ping-capsule
version: "0.1.0"

artifacts:
  - name: murmur-driver-anthropic
    version: "1.0.0"
    runtime: driver

inference:
  transport: http
  endpoint: https://api.anthropic.com
  model: claude-sonnet-5
  api_key: ${ANTHROPIC_API_KEY}
  driver:
    artifact: murmur-driver-anthropic

observability:
  otel_endpoint: http://localhost:4318
name: ping-capsule
version: "0.1.0"

artifacts:
  - name: murmur-driver-openai
    version: "1.0.0"
    runtime: driver

inference:
  transport: http
  endpoint: https://api.openai.com
  model: o3-mini-high
  api_key: ${OPENAI_API_KEY}
  driver:
    artifact: murmur-driver-openai

observability:
  otel_endpoint: http://localhost:4318
name: ping-capsule
version: "0.1.0"

artifacts:
  - name: murmur-driver-deepseek
    version: "1.0.0"
    runtime: driver

inference:
  transport: http
  endpoint: https://api.deepseek.com
  model: deepseek-r1
  api_key: ${DEEPSEEK_API_KEY}
  driver:
    artifact: murmur-driver-deepseek

observability:
  otel_endpoint: http://localhost:4318
Create a task.md input file:
Reply with the single word "pong" and nothing else.
Step 3 — run the capsule and confirm the span arrives
mur run --manifest murmur.yaml --task task.md
The capsule runs one inference turn and exits. The runtime emits a capsule.session span to Tempo immediately at session end.
Wait about 60–90 seconds for Tempo to flush its WAL to a searchable block, then confirm the trace is indexed:
curl -s 'http://localhost:3200/api/search?q=%7B+name+%3D+%22capsule.session%22+%7D' \
  | jq '.traces | length'
The result should be 1. If it is 0, wait another 30 seconds and retry. Tempo's default search window is 15 minutes, so run this query within that window after the capsule exits.
Step 4 — open the topology view
Write the HTML to a file so it is easy to inspect:
mur topology --otel-endpoint http://localhost:3200 --output /tmp/topology.html
Output:
murmur: topology written to /tmp/topology.html
Open /tmp/topology.html in your default browser:
open /tmp/topology.html
The page shows:
- A single green node labelled
ping-capsulewith its duration in milliseconds - The subheading
Time window: 1h — 1 session(s)below the page title - A directed graph rendered by vis.js — drag nodes to rearrange; scroll to zoom
Hover over the node to see the tooltip: capsule name and version, exit status, total duration, and per-span timing (inference ms, tool call ms, shell ms).
To open the graph directly in the browser without an intermediate file path:
mur topology --otel-endpoint http://localhost:3200
The command writes a temp file to /tmp/murmur-topology-<timestamp>.html and opens it immediately.
To see only the most recent session, narrow the window (default is 1h) — for example --window 5m. To get a fully clean slate, restart Tempo (which clears its WAL and local storage).
mur topology --otel-endpoint http://localhost:3200 --window 5m
Step 5 — add a worker capsule (two-node scenario)
This step starts a second capsule, sends it a task that carries a W3C traceparent header linking it to the ping-capsule session from Step 3, and confirms the topology view renders a directed edge between them.
The runtime injects the traceparent header automatically on every murmur:message/send call. In this step we construct the header manually from ping-capsule's span so you can see the full chain without needing a second orchestrator capsule.
Look up ping-capsule's trace and session span from Tempo (uses the span emitted in Step 3):
PING_TRACE=$(curl -s "http://localhost:3200/api/search?q=%7B+name+%3D+%22capsule.session%22+%26%26+resource.service.name+%3D+%22ping-capsule%22+%7D&limit=10&start=$(($(date +%s)-3600))&end=$(date +%s)" \
  | jq -r '[.traces[]] | sort_by(.startTimeUnixNano) | reverse | .[0].traceID')
PING_TRACE=$(printf '%032s' "$PING_TRACE" | tr ' ' '0')
PING_SPAN_B64=$(curl -s "http://localhost:3200/api/traces/${PING_TRACE}" | jq -r '[.batches[].scopeSpans[].spans[] | select(.name=="capsule.session")][0].spanId')
PING_SPAN=$(python3 -c "import base64; print(base64.b64decode('${PING_SPAN_B64}').hex())")
echo "trace: $PING_TRACE  span: $PING_SPAN"
The query filters by service.name = "ping-capsule" — replace ping-capsule in the URL-encoded query with the name: value from your manifest if you chose a different name. Fetching 10 results and sorting by startTimeUnixNano ensures the most recent ping-capsule session is always selected, even if there are older runs still in Tempo's index. PING_SPAN will be a 16-char hex string — Tempo's /api/traces returns spanId as base64 (proto3 JSON encoding for bytes) so the python3 step converts it.
Create worker/murmur.yaml:
name: echo-worker
version: "0.1.0"

artifacts:
  - name: murmur-driver-anthropic
    version: "1.0.0"
    runtime: driver

inference:
  transport: http
  endpoint: https://api.anthropic.com
  model: claude-sonnet-5
  api_key: ${ANTHROPIC_API_KEY}
  driver:
    artifact: murmur-driver-anthropic

observability:
  otel_endpoint: http://localhost:4318

lifecycle:
  task_acceptance: queue
  after_task: sleep
name: echo-worker
version: "0.1.0"

artifacts:
  - name: murmur-driver-openai
    version: "1.0.0"
    runtime: driver

inference:
  transport: http
  endpoint: https://api.openai.com
  model: o3-mini-high
  api_key: ${OPENAI_API_KEY}
  driver:
    artifact: murmur-driver-openai

observability:
  otel_endpoint: http://localhost:4318

lifecycle:
  task_acceptance: queue
  after_task: sleep
name: echo-worker
version: "0.1.0"

artifacts:
  - name: murmur-driver-deepseek
    version: "1.0.0"
    runtime: driver

inference:
  transport: http
  endpoint: https://api.deepseek.com
  model: deepseek-r1
  api_key: ${DEEPSEEK_API_KEY}
  driver:
    artifact: murmur-driver-deepseek

observability:
  otel_endpoint: http://localhost:4318

lifecycle:
  task_acceptance: queue
  after_task: sleep
Start the worker in the background and capture its URL:
mur run --manifest worker/murmur.yaml > worker.log 2>&1 &
sleep 2
WORKER_URL=$(grep 'murmur: url' worker.log | awk '{print $3}')
echo "Worker: $WORKER_URL"
Send the worker a task with the traceparent header and capture the task ID:
TASK_ID=$(curl -s -X POST "http://${WORKER_URL}" \
  -H "Content-Type: application/json" \
  -H "traceparent: 00-${PING_TRACE}-${PING_SPAN}-01" \
  -d '{
    "jsonrpc": "2.0",
    "id": 1,
    "method": "message/send",
    "params": {
      "message": {
        "messageId": "msg-001",
        "contextId": "ctx-001",
        "role": "user",
        "parts": [{"text": "Reply with the single word pong."}]
      }
    }
  }' | jq -r '.result.id')
echo "Task: $TASK_ID"
Poll tasks/get until the session completes:
while true; do
  STATE=$(curl -s -X POST "http://${WORKER_URL}" \
    -H "Content-Type: application/json" \
    -d "{\"jsonrpc\":\"2.0\",\"id\":2,\"method\":\"tasks/get\",\"params\":{\"id\":\"${TASK_ID}\"}}" \
    | jq -r '.result.status.state')
  echo "State: $STATE"
  [ "$STATE" = "completed" ] || [ "$STATE" = "failed" ] && break
  sleep 2
done
Stop the worker:
kill %1
Wait 60–90 seconds for Tempo to flush the new span, then run the topology view using the default 1h window so both ping-capsule and echo-worker are included:
mur topology --otel-endpoint http://localhost:3200 --output /tmp/topology-two.html
Open /tmp/topology-two.html. The page shows two green nodes — ping-capsule and echo-worker — connected by a directed edge. The subheading reads 2 session(s). Inspect window.TOPOLOGY_DATA in the page source to confirm two entries in "nodes" and one entry in "edges":
{
  "edges": [{ "from": "<ping-capsule-traceID>", "to": "<echo-worker-traceID>", "weight": 1 }]
}
The topology builder resolves the edge by looking up PING_SPAN across all spans indexed from Tempo. It finds that span belongs to ping-capsule's trace, and since echo-worker's session span records it as parentSpanId, a directed edge is drawn from ping-capsule to echo-worker.
Step 6 — inspect the embedded graph data
Every generated HTML page embeds the full graph data as a JavaScript object. To extract it for scripting or debugging:
grep -o 'window\.TOPOLOGY_DATA = {.*}' /tmp/topology-two.html \
  | sed 's/window\.TOPOLOGY_DATA = //' \
  | jq .
The output shape:
{
  "nodes": [
    {
      "id": "<traceID>",
      "capsule_name": "ping-capsule",
      "capsule_version": "0.1.0",
      "exit_status": "ok",
      "start_time_ms": 1700000000000,
      "duration_ms": 823,
      "inference_ms": 601,
      "tool_ms": 0,
      "shell_ms": 0
    }
  ],
  "edges": []
}
Node colors map directly from exit_status:
| exit_status | Color |
|---|---|
ok or completed |
Green (#4caf50) |
failed |
Red (#f44336) |
running |
Yellow (#ffeb3b) |
| anything else | Orange (#ff9800) |
Summary
| What to verify | How to check |
|---|---|
| Spans reach Tempo | curl .../api/search?q=... returns traces.length > 0 |
| Single node appears | HTML contains the capsule name; node is green for ok exits |
| Two-node scenario | Both capsule names in window.TOPOLOGY_DATA.nodes; one entry in window.TOPOLOGY_DATA.edges |
| Inspect raw data | grep window.TOPOLOGY_DATA in the HTML, pipe through jq |