How to work with capsule trace spans in Grafana
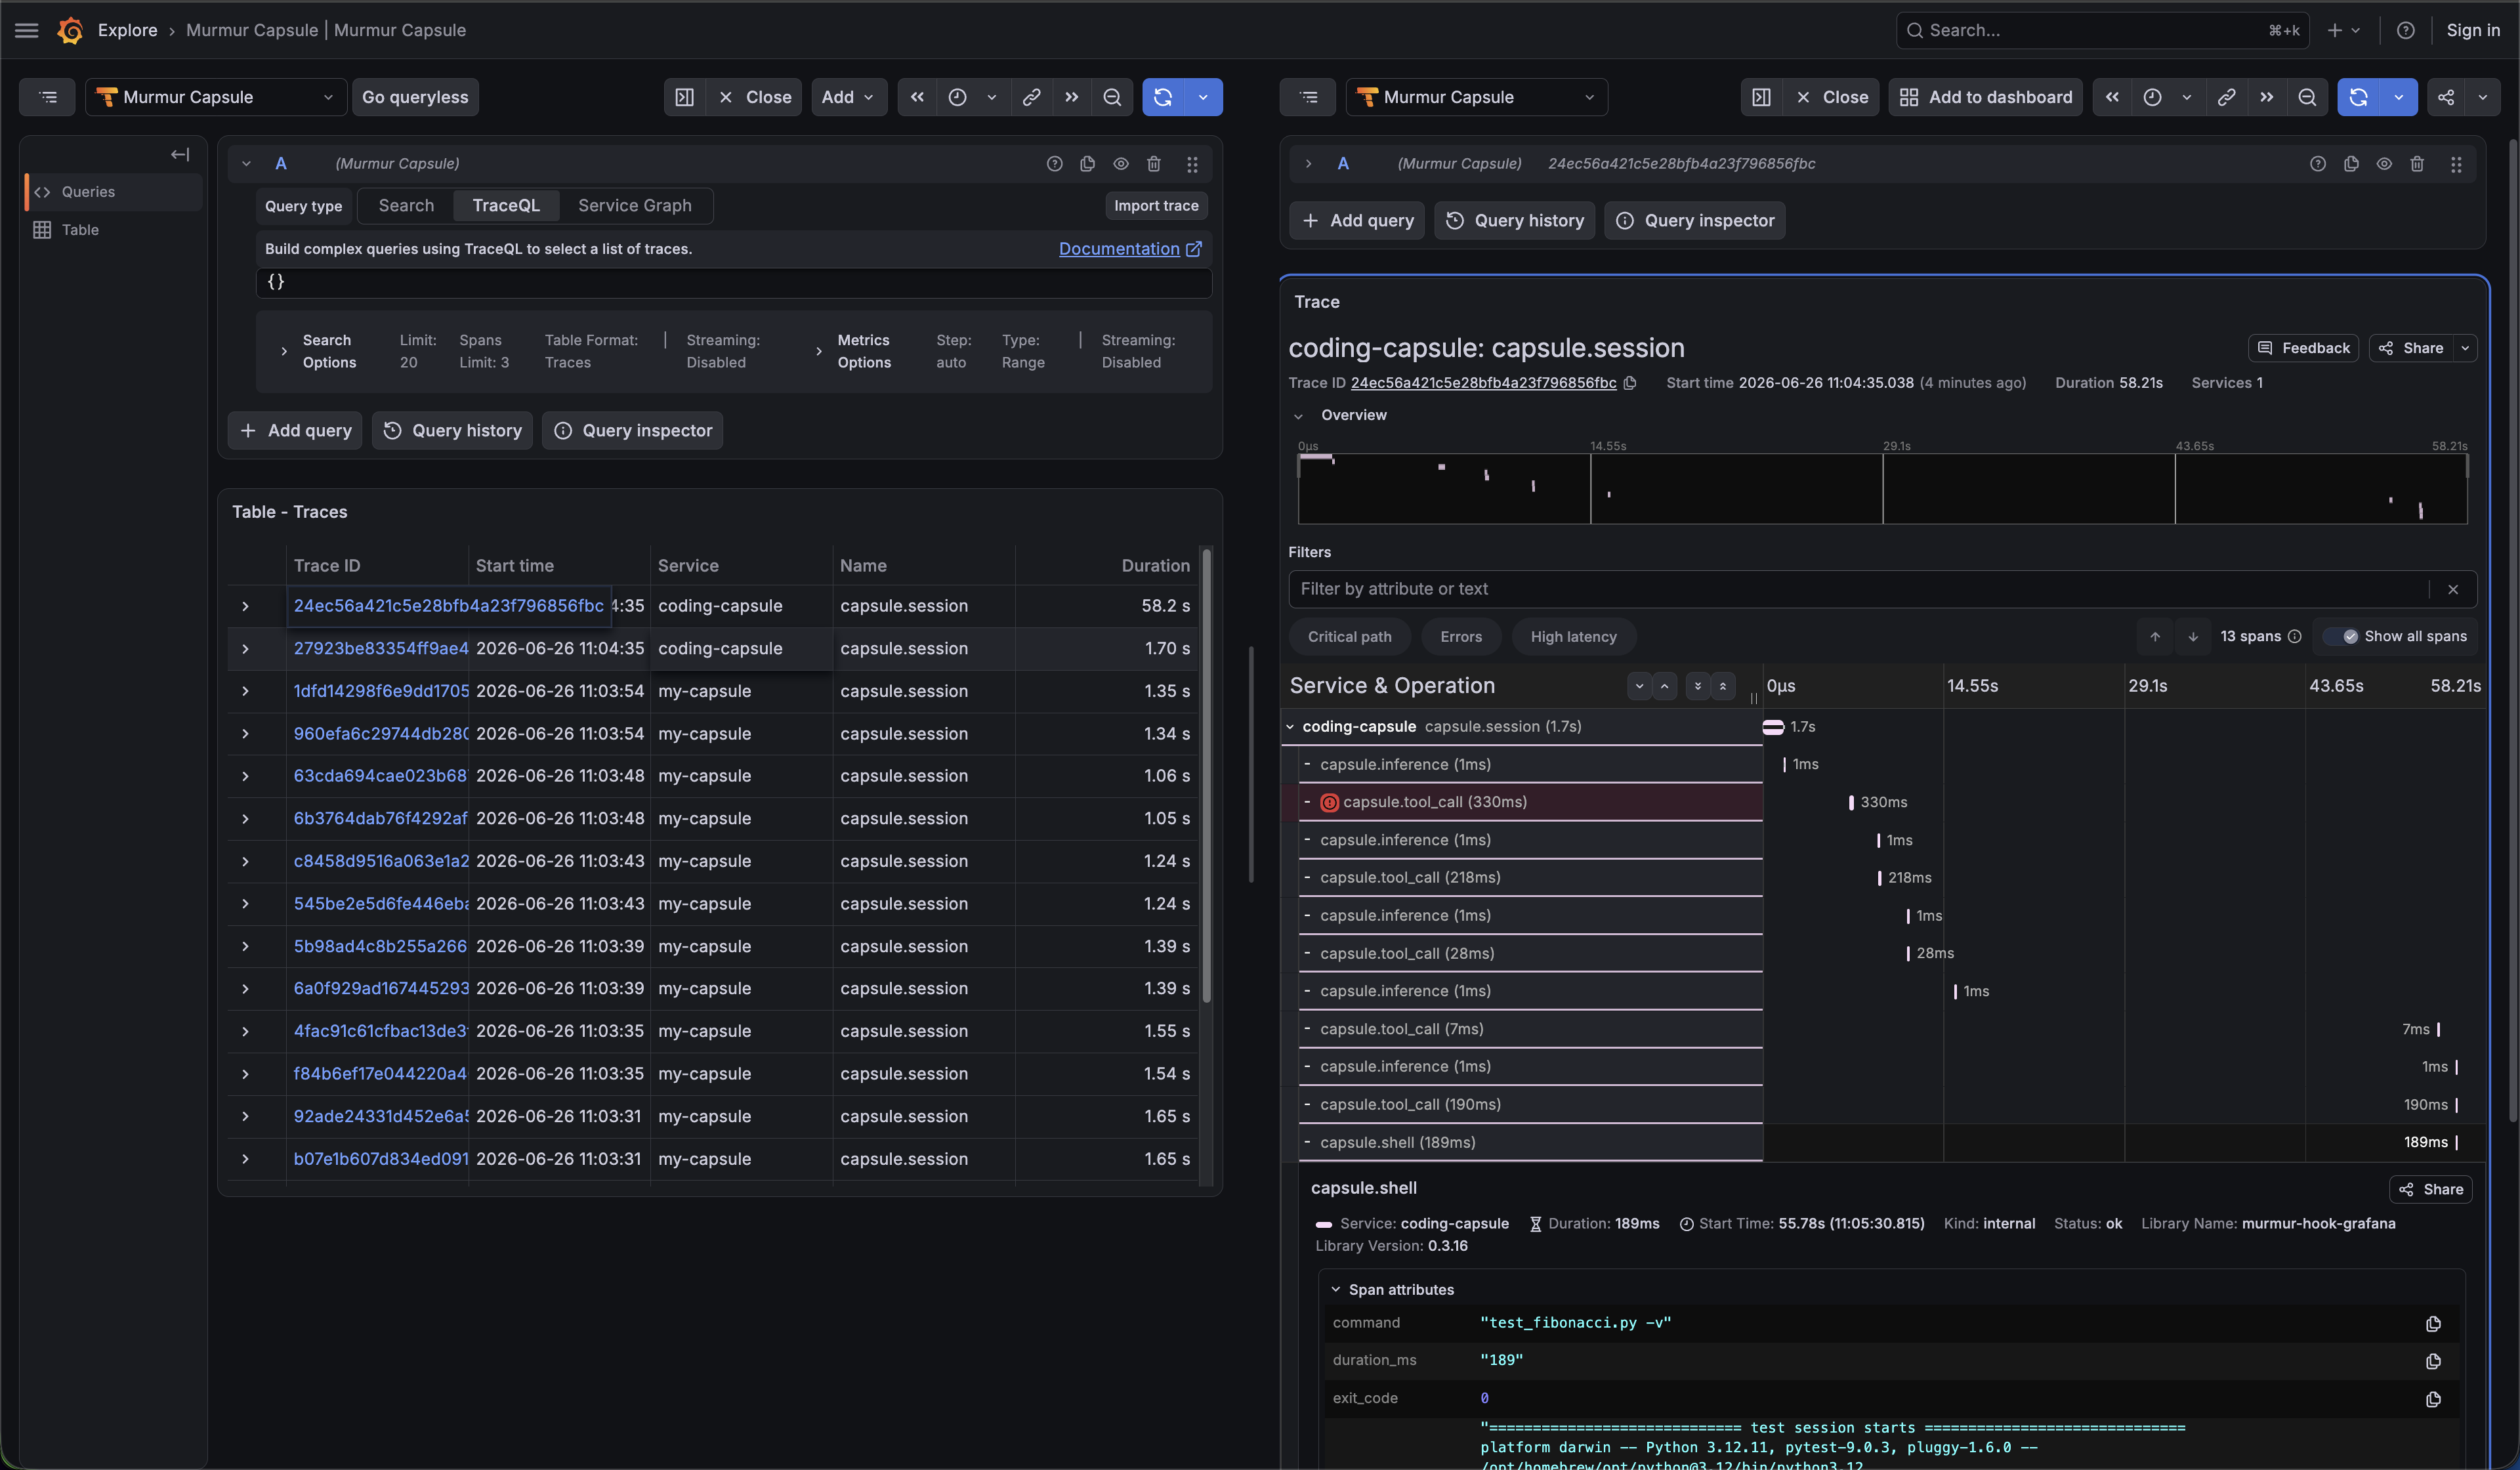
Every Murmur session emits an OpenTelemetry trace when observability.otel_endpoint is set in the manifest. The trace contains a root capsule.session span covering the full session lifecycle, with nested child spans for each inference turn, tool call, and shell command. This guide walks through routing those spans to a Grafana Tempo backend and using Grafana's Explore view to inspect timing and attributes for individual sessions.
This is distinct from mur trace show, which reads the local trace.jsonl file without requiring an external backend.
The relevant manifest options are:
| Option | Controls |
|---|---|
| observability.otel_endpoint | OTLP/HTTP endpoint where the runtime posts spans at session end |
Step 1 — start Tempo and Grafana
The runtime writes spans over OTLP/HTTP to port 4318. Tempo stores and serves traces over HTTP on port 3200. Grafana reads from Tempo and listens on port 3000.
Create a tempo.yaml configuration file:
server:
  http_listen_port: 3200

ingester:
  max_block_duration: 1m

distributor:
  receivers:
    otlp:
      protocols:
        http:
          endpoint: "0.0.0.0:4318"

storage:
  trace:
    backend: local
    wal:
      path: /var/tempo/wal
    local:
      path: /var/tempo/traces
ingester.max_block_duration: 1m cuts WAL blocks every minute. Without it, spans are not queryable for up to 30 minutes after a session ends.
Create a docker-compose.yaml file in the same directory as tempo.yaml:
services:
  tempo:
    image: grafana/tempo:2.9.0
    command: ["-config.file=/etc/tempo.yaml"]
    volumes:
      - ./tempo.yaml:/etc/tempo.yaml
    ports:
      - "4318:4318"
      - "3200:3200"

  grafana:
    image: grafana/grafana:13.1.0
    ports:
      - "3000:3000"
    environment:
      - GF_AUTH_ANONYMOUS_ENABLED=true
      - GF_AUTH_ANONYMOUS_ORG_ROLE=Admin
    volumes:
      - ./grafana-datasources.yaml:/etc/grafana/provisioning/datasources/tempo.yaml
GF_AUTH_ANONYMOUS_ENABLED and GF_AUTH_ANONYMOUS_ORG_ROLE=Admin grant full admin access without a login prompt — only use this for local development.
The grafana-datasources.yaml mount provisions the Tempo data source on startup, so Explore opens with it pre-selected. Provisioning recreates the data source every time the container starts and survives docker compose down; a data source added through the UI lives in Grafana's internal database and is lost whenever the container is recreated.
Create a grafana-datasources.yaml file in the same directory:
apiVersion: 1
datasources:
  - name: Murmur Capsule
    type: tempo
    uid: murmur-capsule-tempo
    url: http://tempo:3200
    access: proxy
    isDefault: true
The URL uses the Tempo service name tempo (not localhost): Grafana reaches Tempo over the Compose network, where the host is the service name from docker-compose.yaml.
Pin Tempo to 2.9.0 — do not use 2.10+
Tempo 2.10+ has a regression that breaks TraceQL search on the local
storage backend: spans are ingested and retrievable by trace ID, but
queries such as {name="capsule.session"} return zero results. Versions
up to and including 2.9.0 work correctly. If your search results are
always empty, check the running image with docker compose ps and pin
grafana/tempo:2.9.0.
Start both services:
docker compose up -d
Confirm Tempo is ready:
curl -s http://localhost:3200/ready
The response is the string ready.
Step 2 — configure the manifest
Create a murmur.yaml file with observability.otel_endpoint pointing to Tempo's OTLP ingest port. The murmur-hook-grafana artifact adds a hook-side enriched span tree on top of the native emission path — both are independent and a failure in one does not suppress the other:
name: my-capsule
version: "0.1.0"

artifacts:
  - name: murmur-driver-anthropic
    version: "1.0.0"
    runtime: driver
  - name: murmur-hook-grafana
    version: "1.0.0"
    runtime: hook
    capabilities:
      network:
        allow:
          - http://localhost:4318

inference:
  transport: http
  endpoint: https://api.anthropic.com
  model: claude-sonnet-5
  api_key: ${ANTHROPIC_API_KEY}
  driver:
    artifact: murmur-driver-anthropic

observability:
  otel_endpoint: http://localhost:4318
name: my-capsule
version: "0.1.0"

artifacts:
  - name: murmur-driver-openai
    version: "1.0.0"
    runtime: driver
  - name: murmur-hook-grafana
    version: "1.0.0"
    runtime: hook
    capabilities:
      network:
        allow:
          - http://localhost:4318

inference:
  transport: http
  endpoint: https://api.openai.com
  model: o3-mini-high
  api_key: ${OPENAI_API_KEY}
  driver:
    artifact: murmur-driver-openai

observability:
  otel_endpoint: http://localhost:4318
name: my-capsule
version: "0.1.0"

artifacts:
  - name: murmur-driver-deepseek
    version: "1.0.0"
    runtime: driver
  - name: murmur-hook-grafana
    version: "1.0.0"
    runtime: hook
    capabilities:
      network:
        allow:
          - http://localhost:4318

inference:
  transport: http
  endpoint: https://api.deepseek.com
  model: deepseek-r1
  api_key: ${DEEPSEEK_API_KEY}
  driver:
    artifact: murmur-driver-deepseek

observability:
  otel_endpoint: http://localhost:4318
Step 3 — install dependencies
mur install
Different ways to install artifacts
mur install needs to know where to fetch artifacts from. You have two options:
Option A — configure a registry source in ~/.murmur/config.yaml:
registry:
  default: official
  sources:
    - name: official
      type: github
      repo: <owner>/<repo>
      token: "${GITHUB_TOKEN}"
Then install by artifact name and version:
mur install <artifact-name@version>
Option B — pass a full GitHub reference and skip configuration entirely:
mur install github:<username>/<repo>@<tag>
See Installing artifacts to learn more.
Step 4 — run the capsule
Create a task.md file:
Reply with the single word "pong" and nothing else.
Run the capsule:
mur run --task task.md
murmur: url localhost:52222
session: ses_019ed2af53da75c2aefee84ee10c34af
status:  ok
The runtime posts the span tree to Tempo at session end. Wait about 60–90 seconds for Tempo to flush its WAL to a searchable block.
Confirm the trace is indexed:
curl -s 'http://localhost:3200/api/search?q=%7Bname%3D%22capsule.session%22%7D' \
  | jq '.traces | length'
The result should be 1. If it is 0, wait another 30 seconds and retry.
Step 5 — explore spans
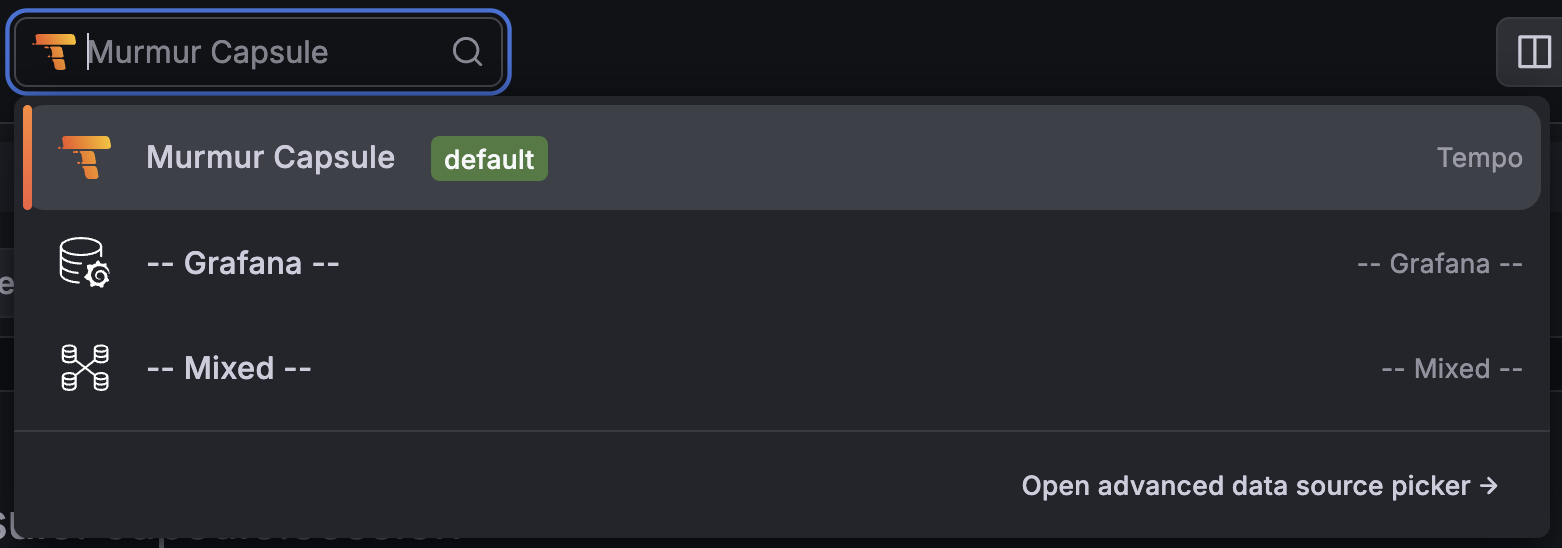
Navigate to Explore in the left sidebar. Open the data source picker at the top and select Tempo — the source provisioned in Step 1, marked default. Grafana does not always pre-select it, so confirm Tempo is chosen before querying.
Switch the query mode to TraceQL and enter:
{resource.service.name="my-capsule"}
Click Run query. The results panel lists one row per session. Click a trace ID to open the span tree.
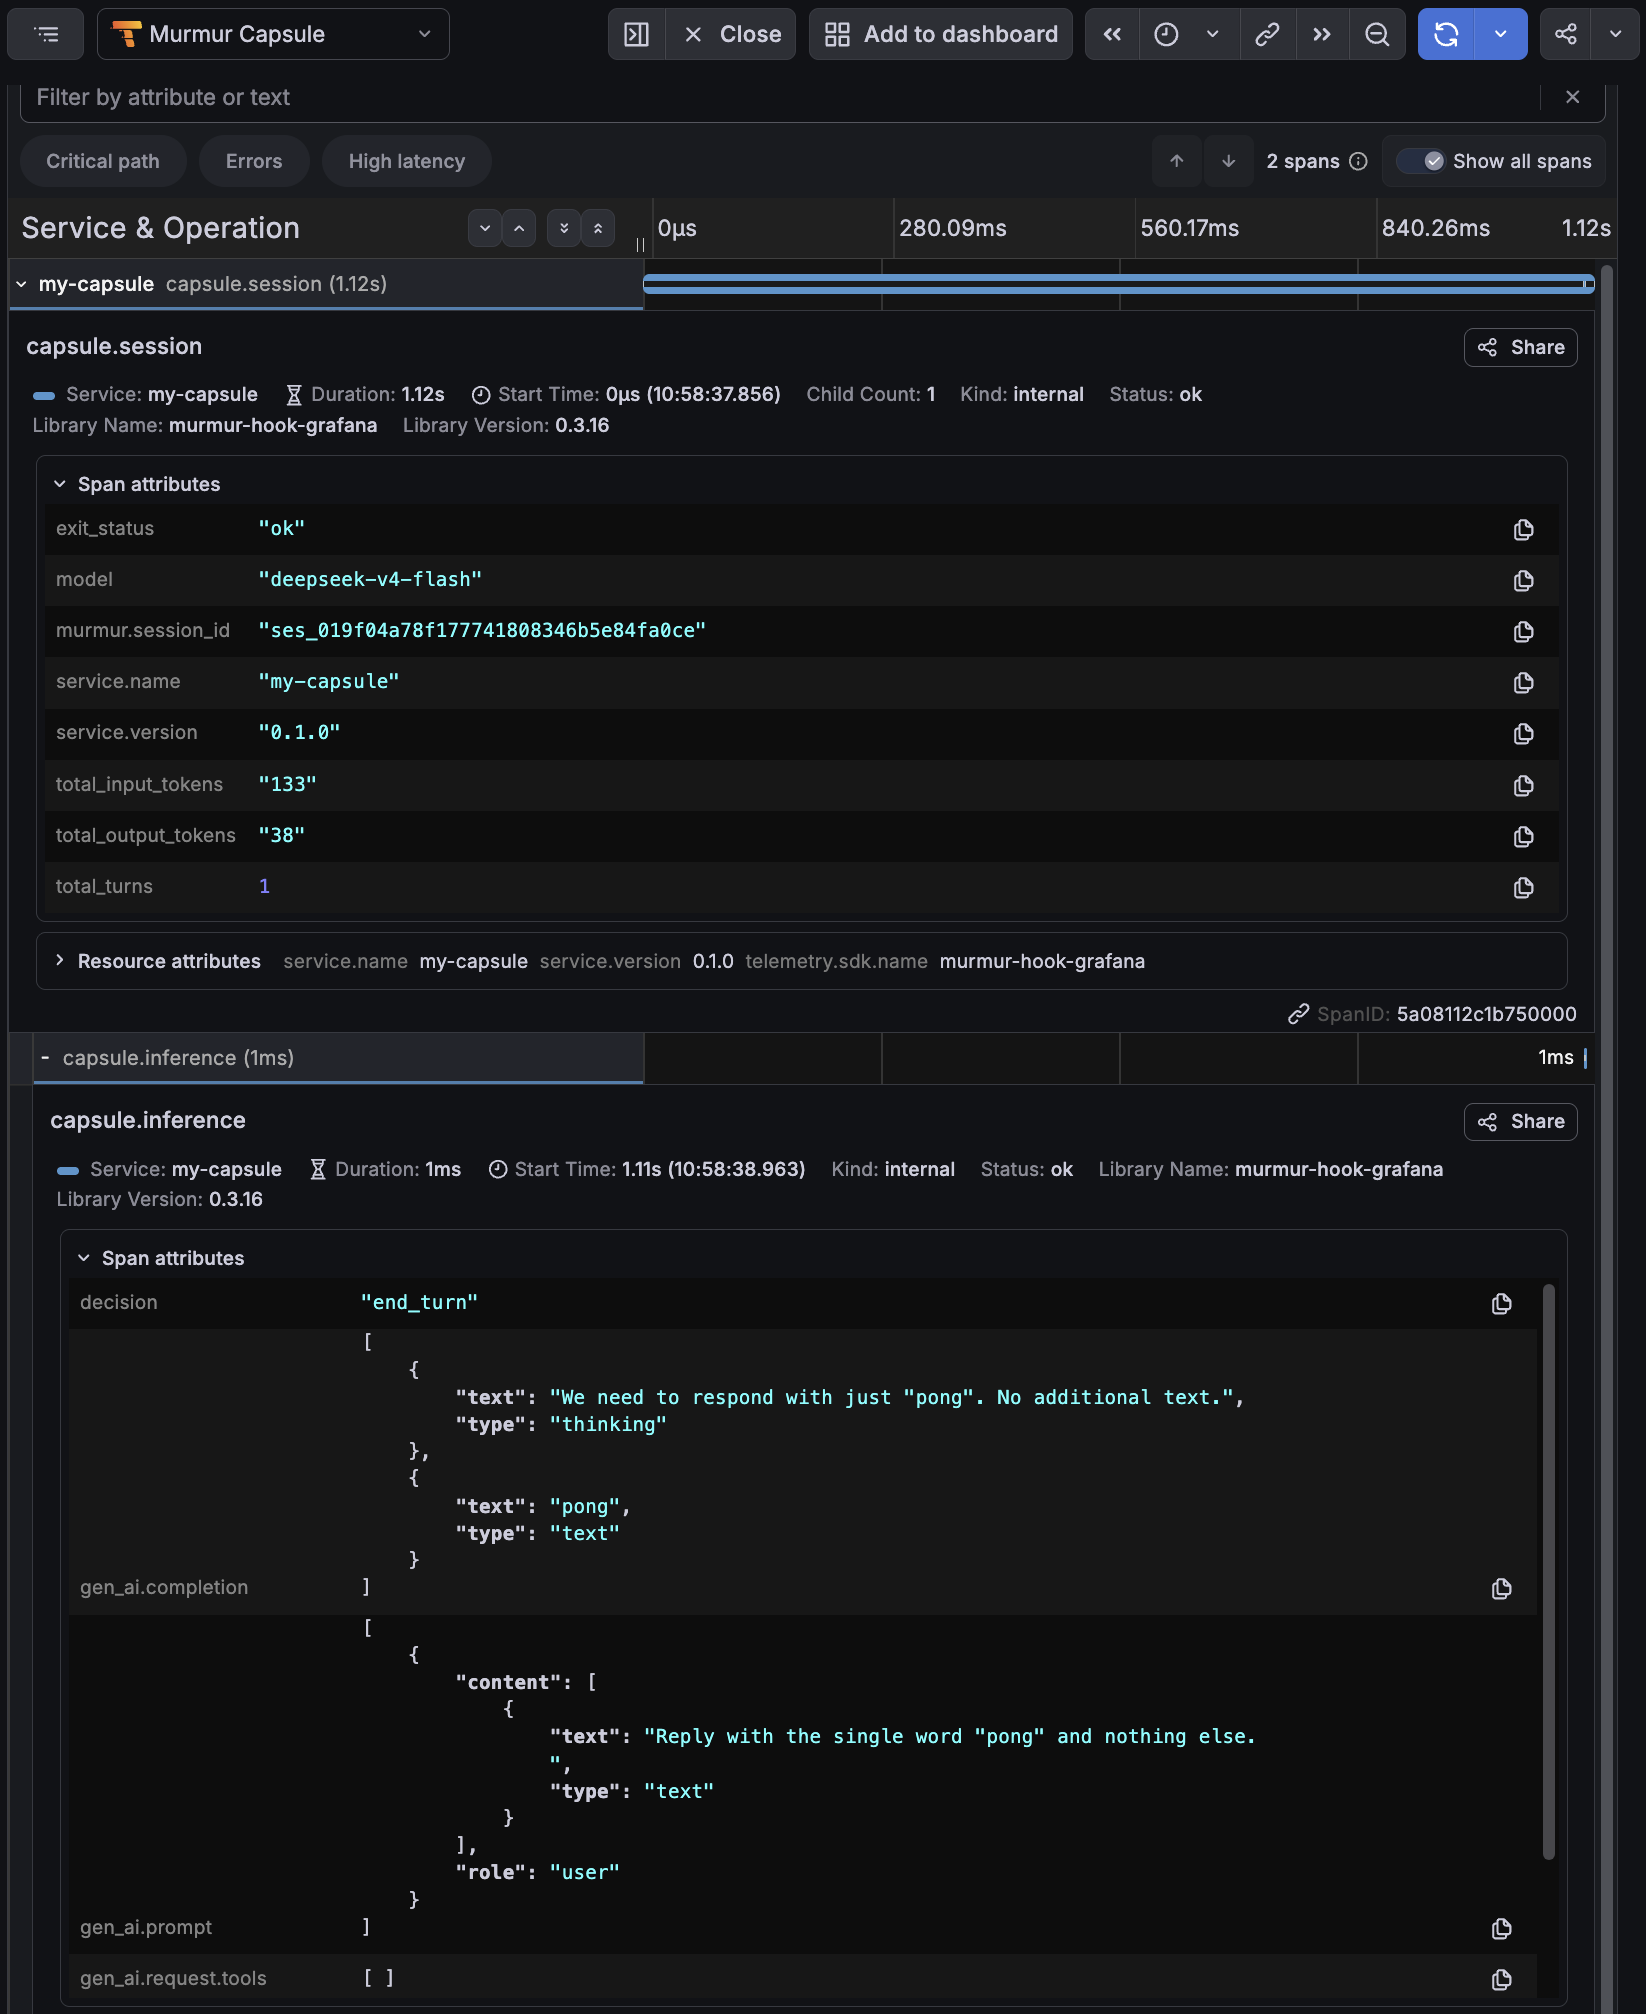
Click the trace link in the Table - Traces panel to open the trace detail, as shown above.
Key attributes on the capsule.session root span:
| Attribute | Value |
|---|---|
service.name |
Capsule name from murmur.yaml |
service.version |
Capsule version from murmur.yaml |
model |
Model identifier used for inference |
exit_status |
ok, failed, max_turns_reached, etc. |
murmur.session_id |
Session UUID — matches the workdir folder name |
Key attributes on capsule.inference child spans:
| Attribute | Value |
|---|---|
turn |
Turn number (0-indexed) |
input_tokens |
Tokens in the inference request |
output_tokens |
Tokens in the model's response |
decision |
What the model decided: tool_call or end_turn |
tool_name |
Name of the tool called (when decision is tool_call) |
To filter to sessions that exited cleanly:
{resource.service.name="my-capsule" && .exit_status="ok"}
To find all sessions that made at least one tool call:
{resource.service.name="my-capsule"} >> {name="capsule.tool_call"}
Once spans are flowing into Tempo, the topology view can query the same backend to reconstruct which capsule called which — it reads capsule.session spans, follows their parent–child relationships, and renders an interactive graph in the browser where each node is a session and each edge is an A2A delegation.
Summary
| What to do | How |
|---|---|
| Emit spans | Set observability.otel_endpoint: http://localhost:4318 in murmur.yaml |
| Enrich spans with hook-side data | Declare murmur-hook-grafana as a runtime: hook artifact, and grant it the collector host via the entry's own capabilities.network.allow — hooks have no network by default (see Hook capabilities) |
| Confirm spans arrived | curl .../api/search?q=... returns traces.length > 0 |
| Find sessions in Grafana | Explore → Tempo → TraceQL {resource.service.name="my-capsule"} |
| Inspect a session | Click a trace ID → flame graph → span detail panel |
| Filter by exit status | {resource.service.name="my-capsule" && .exit_status="ok"} |